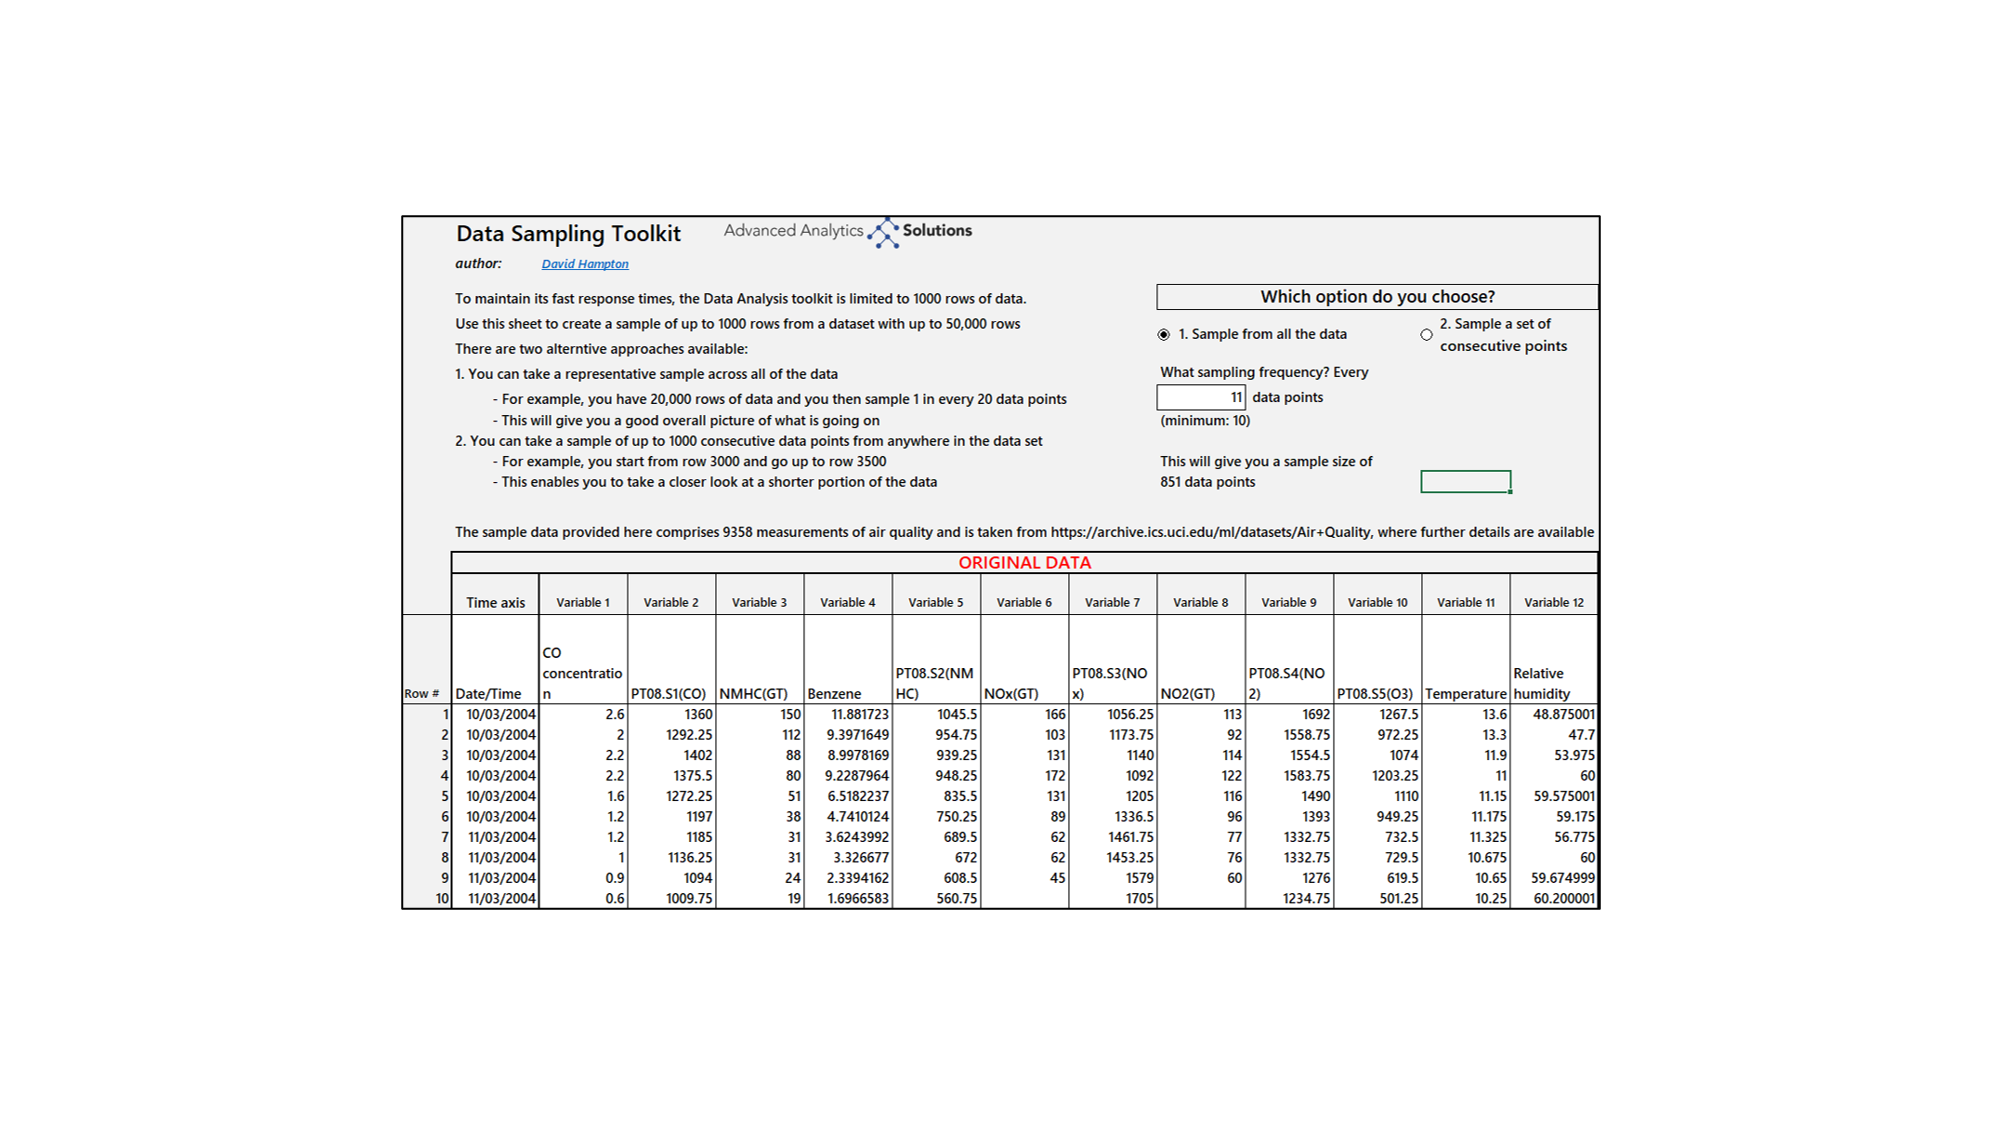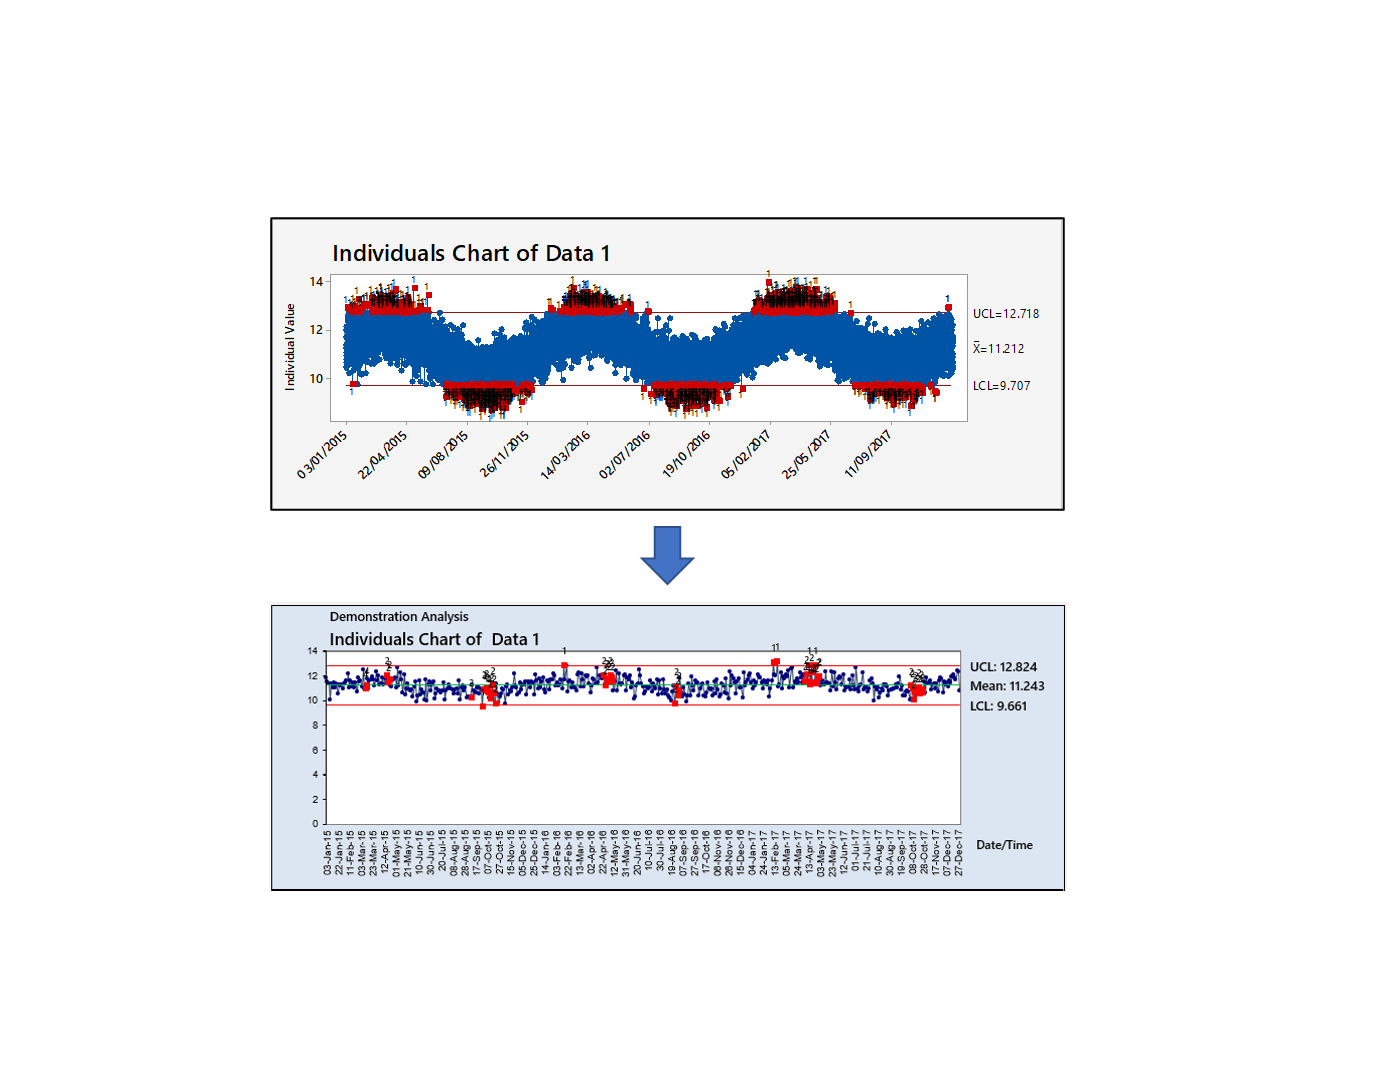


Large data sets (more than a few hundred points) may seem like a gift for data analysis, but the reality can be more complex than that. Time Series Plots and Control Charts become illegible, and you can miss some helpful patterns if you only analyze the complete data set.
There are two ways you can speed up your time to results:
The Data Sampling Toolkit allows you to do both of these things, quickly and easily without the fuss of manually setting up sampling plans.

The Data Sampling Toolkit makes it easy to take regular samples from your data, at whatever frequency you choose.
You will see the same overall patterns that exist in the full data set, but it will be easier to see what’s going on because the graphs will be a lot less crowded
Your source can contain up to 50,000 rows of data and the sample, up to 1,000 rows.

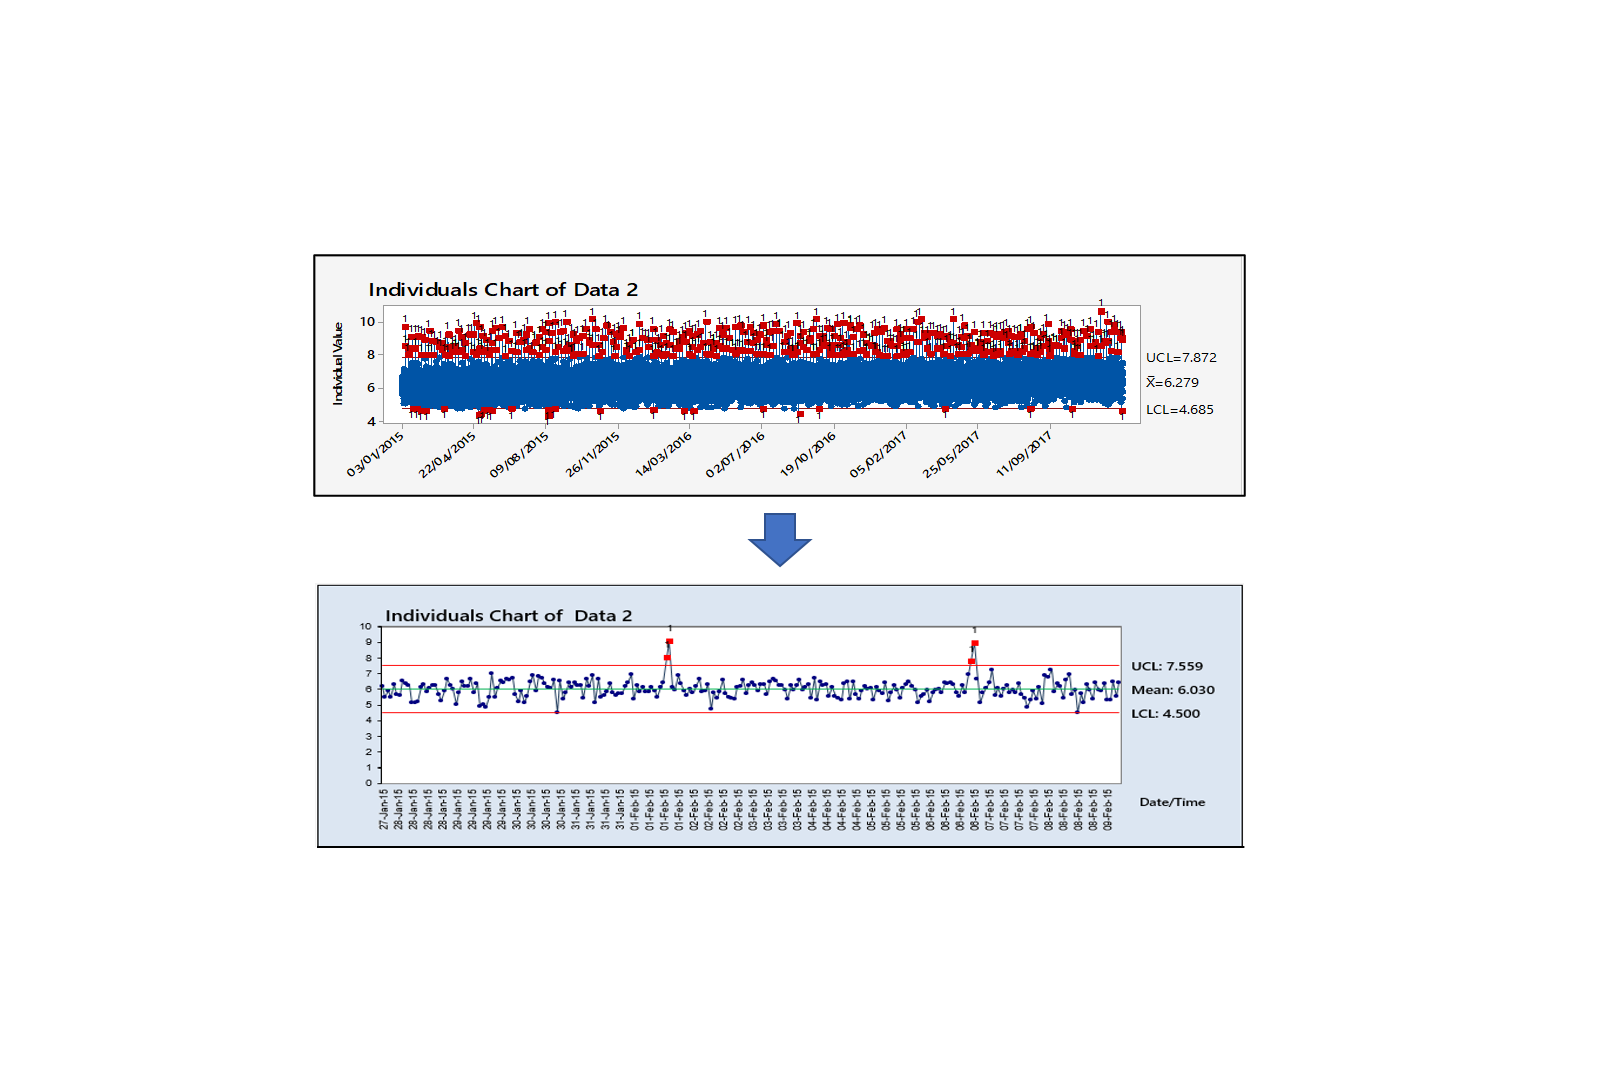
This option enables you to study variation over a shorter period of time.
You may be able to see patterns that are not visible when looking at all the data points, because a shorter time window enables you to see greater detail.
In this example, the segment of approximately two months reveals that there is a buildup at the end of the month that cannot clearly be seen in the full data set.