
I’ve been working with a client lately who has been recruiting quite extensively into a specialist contact centre operation.
Because it is a contact centre they gets lots, and lots … and lots of applicants. Because it is a bit specialist not all of them are suitable but all have to be looked at as the specialist element is pretty hard to recruit for.
They have a team of recruiters who read and action applications. The applications are categorised into 4 buckets as inexperienced, not qualified, sloppy applications or suitable for interview.
The team spend ages re-reading and re-assessing applications – they can’t seem to agree on how to judge the applications.
Enter the Attribute Agreement Analysis! This lets us quantify the level of disagreement between appraisers in situations just like this.
Here’s what we did …
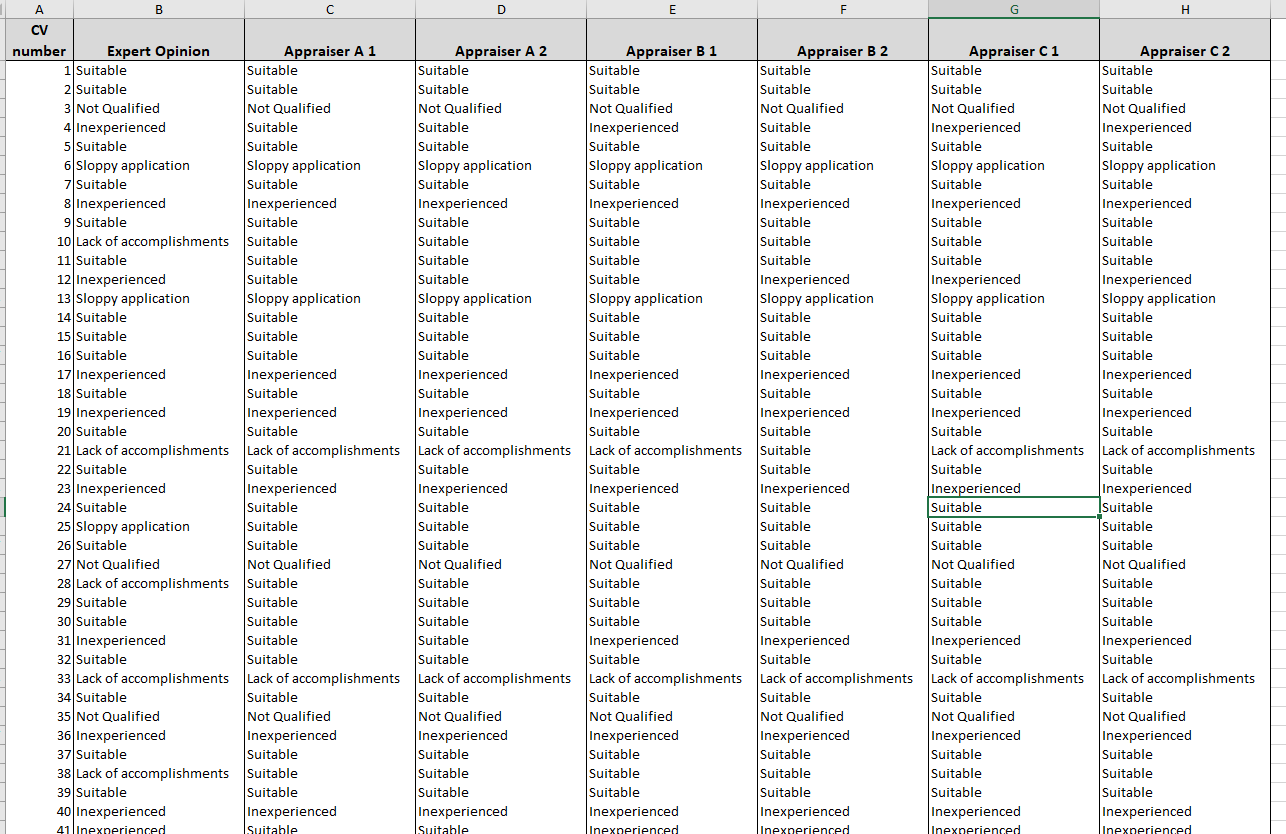
First we took a representative sample of 100 applications, each of 3 recruiters assessed them and placed them into one of the 4 buckets. This they did twice.
The Head of Recruitment then carried out an expert assessment and again placed each application into one of the 4 buckets.
The data looks like this …
Putting it into a rather useful analysis package – my weapon of choice happens to be Minitab – I then ran an Attribute Agreement Analysis operation, here’s the results.
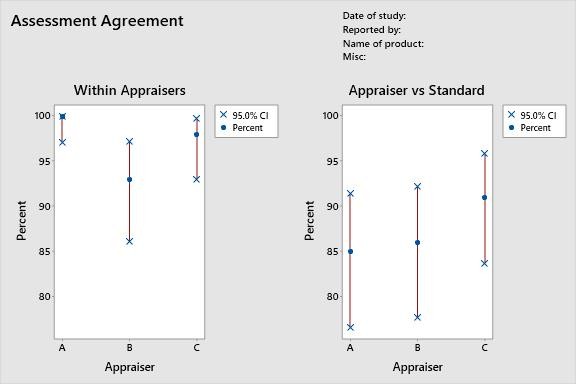
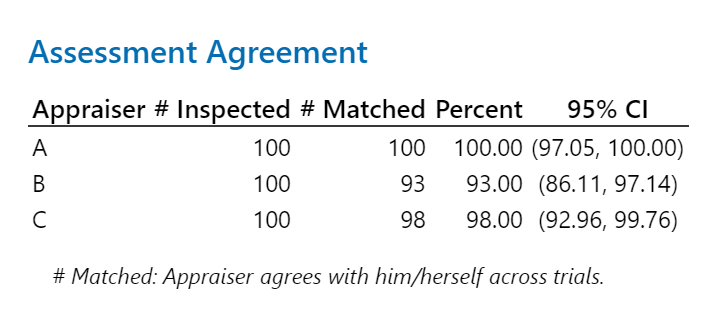
In the left chart the agreements of each of the team are shown, you can see that A has a 100%, B a 93% and C a 98% agreement respectively. This is their agreement within themselves – so it measures how consistent they were at classifying an application as suitable the first and second time round.
High 90+% is pretty reasonable here. The trouble then comes when we look at the right hand chart, the percentages have all dropped … the team are applying a consistent standard within themselves but it just isn’t the same as the Head of Recruitment.
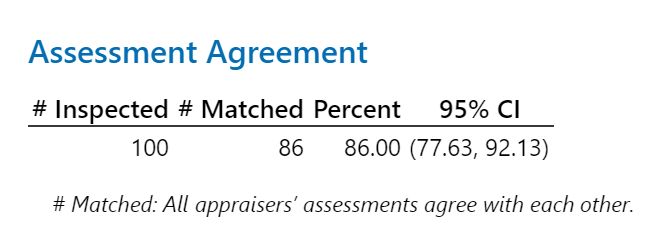
The assessment agreement stats show this … overall we have an 79% agreement. Not terrible bad but equally not great, the chances are we are passing over good, hard to recruit, candidates and interviewing candidates who don’t have the required characteristics – 21% of them as well …
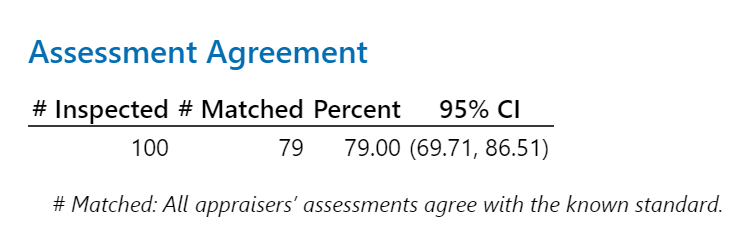
So, let’s find out what’s going on …
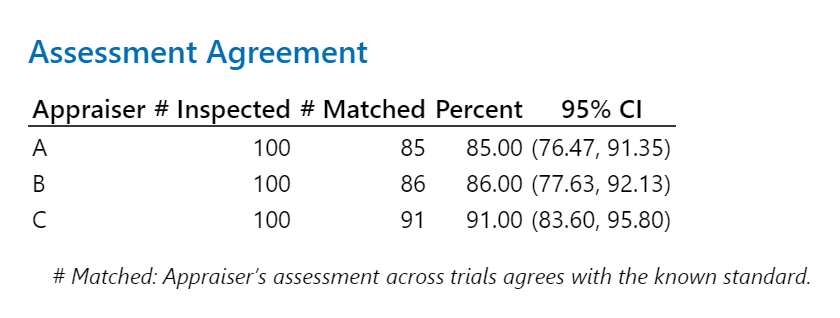
Actually we can see that team member A is the worst at agreeing with the standard, with team member B close behind. If we can sort this out then we will get better results.
We can then take a look at how well each of the team characterise the candidates into the buckets. To do this we use what is know as the Kappa value. This number is a measure of how much the assessment was guesswork, close to 1 = not guess work, less than 0.7 = pretty much guesswork.
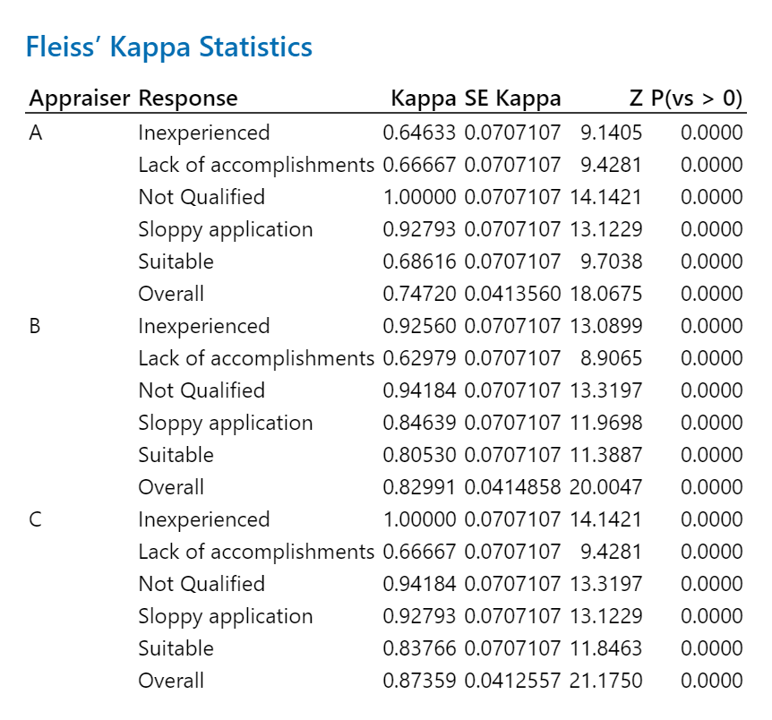
So we can now see that what each team member isn’t so good at characterizing. For instance Team member A is not so good at characterizing inexperience, team member B isn’t so good at lack of accomplishments and team member C also not so good at lack of accomplishments.
So not only does this technique show us how much faith we can have in our measurement and classification processes but it also tells us pretty specifically what to go improve and where.
That’s not bad.
Dead easy to do, low cost and really insightful – I’ll leave it with you. Give me a call if you need any help with it.
About the author
Michael Akers is a Partner with Advanced Analytics Solutions. He is a Lean Six Sigma Master Black Belt and improvement practitioner with over 35 years of experience of practical application of problem solving in a range of industries including many years in Automotive. He is the the author of “Exploring, Analysing and Interpreting Data with Minitab 18”, he writes on improvement and strategy topics, consults around the world and his latest book is available on Amazon, Apple’s iBooks platform and Google Play.